
Website traffic in June
1.096+259,3%
305 → 1.096
March compared with June
As labelled Traffic in the website report.

From planning and content to communication and operational coordination, MERA builds a connected marketing rhythm for the brand and its locations.
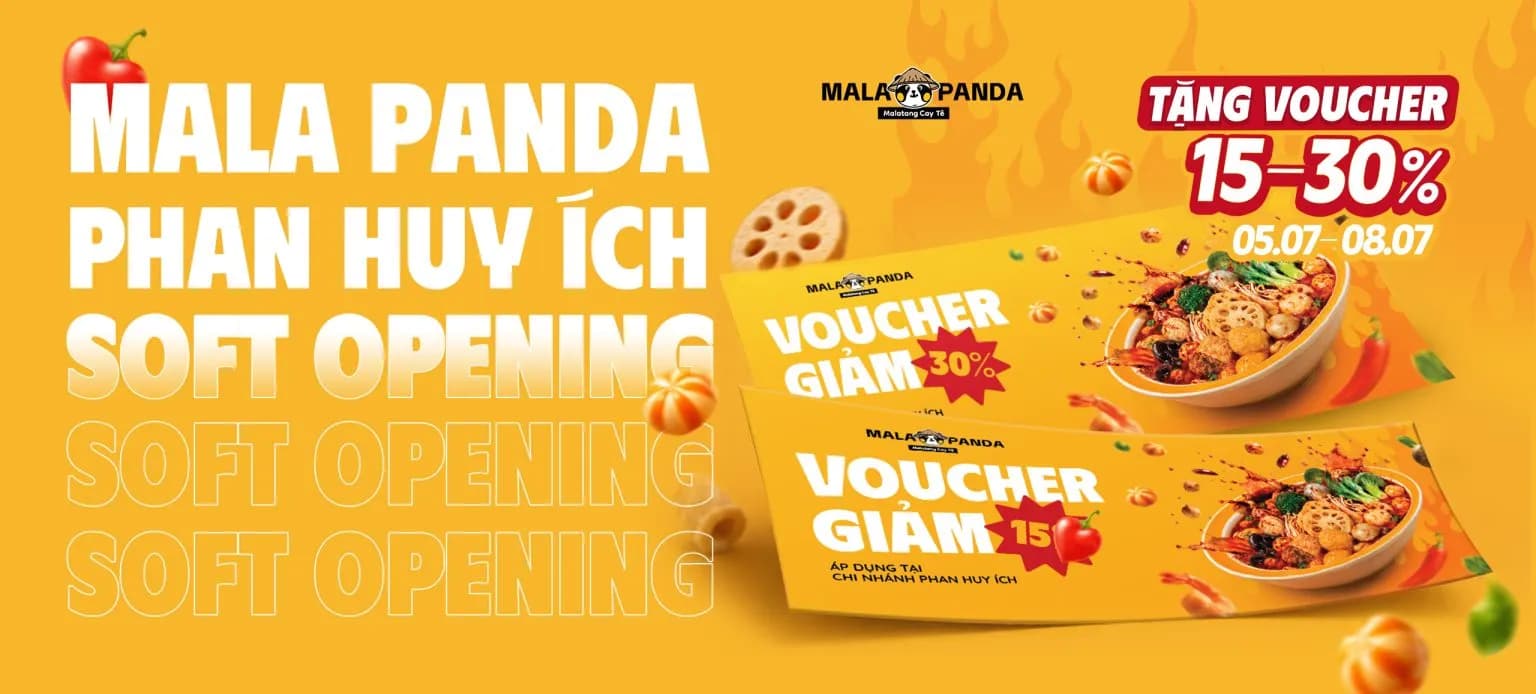
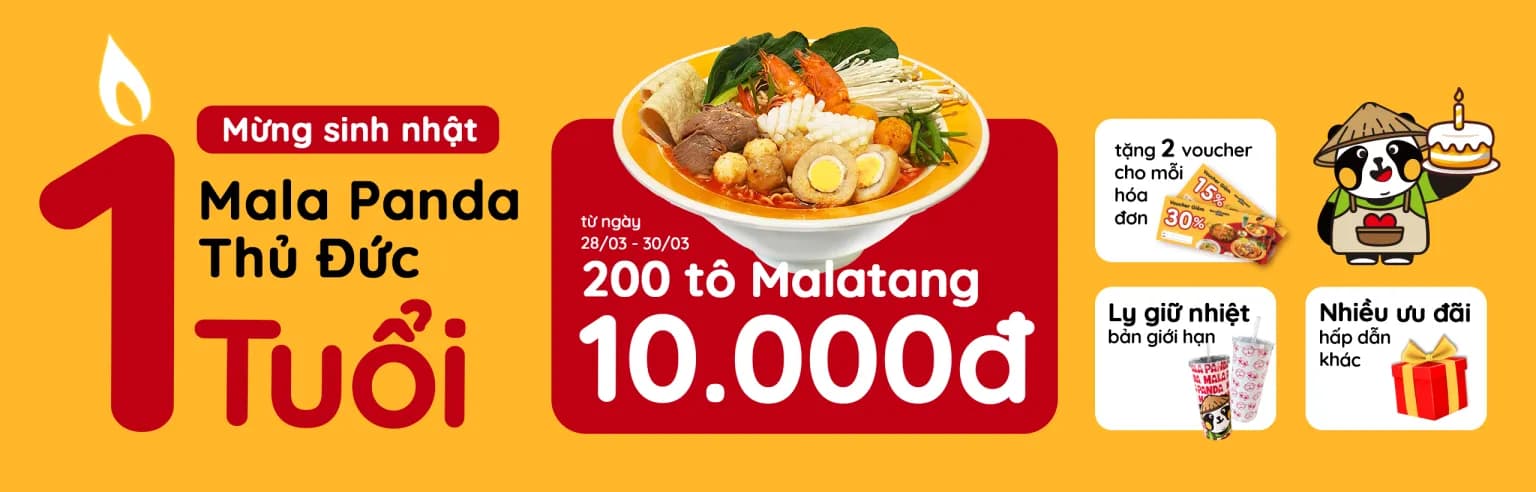
Mala Panda is a Malatang F&B brand offering a customizable dining experience across its locations. The challenge goes beyond appealing food imagery: customers need to understand the product, find a nearby store and have a clear reason to try it. Opening campaigns need a consistent story across social, the website and the store experience.
MERA connects strategy, the IMC plan, photography and video, website content, advertising and operational coordination into a shared execution rhythm. Content is organized around attention, experience, offers and finding the store, rather than isolated posts. The Phan Huy Ich campaign is one example of this approach.
Website topics around products, dining, locations and franchising give customers more ways to explore the brand. Reported traffic moves from 305 in March to 1,096 in June, a 259.3% increase. This is a discoverability signal, showing the website playing a stronger role in brand exploration.
In July, the Phan Huy Ich Maps profile records 6,178 views, 520 interactions and 231 direction requests, alongside 257 menu views and 11 calls. These show how people move from exploration toward action. They indicate intent, not confirmed store visits, and the increase also reflects a new store opening.
The opening report records 184,379 KOC views across four platforms and 1,959 shares. Experience led perspectives complement brand content and extend the Mala Panda story across more touchpoints. Personnel coordination, collaboration across departments and regular reporting connect the plan with execution and inform the next priorities.

Source: Phan Huy Ich Grand Opening report, WEBSITE, GG MAP and KOC tabs. Website compares March with June; Google Maps compares June with July. KOC metrics are recorded campaign totals.
305 → 1.096
March compared with June
As labelled Traffic in the website report.
47 → 6.178
June compared with July
Phan Huy Ich business profile.
11 → 520
June compared with July
Google Maps interactions, not unique customers.
11 → 231
June compared with July
A visit intent signal, not verified store visits.
0 → 257
June compared with July
Absolute change because the baseline is zero.
0 → 11
June compared with July
As recorded under Calls in the report.
Phan Huy Ich opening campaign
Reported total views; no prior period for a growth comparison.
Phan Huy Ich opening campaign
KOC report total, not a before/after increase.
Market research, audience definition, messaging and an integrated plan that connects every channel.
Food, space and customer experience photography, with social videos, campaign edits and founder storytelling.
Content pillars, publishing calendars and website articles built around the customer journey, with clear product, brand and location information.
Connect creative with paid distribution and relevant touchpoints, adjusting budgets, messages and delivery through performance monitoring.
Coordinate marketing personnel and client departments so content, offers and store execution stay aligned.
Work alongside the client with on site collaboration and weekly, monthly and quarterly reporting that turns data into actionable priorities.